
 How to use ECG Buddy Mobile > Analyze an ECG
 INDEX
INDEX Follow along in order!
Click on the number you want to read to jump straight to that guide
1. How to analyze an ECG
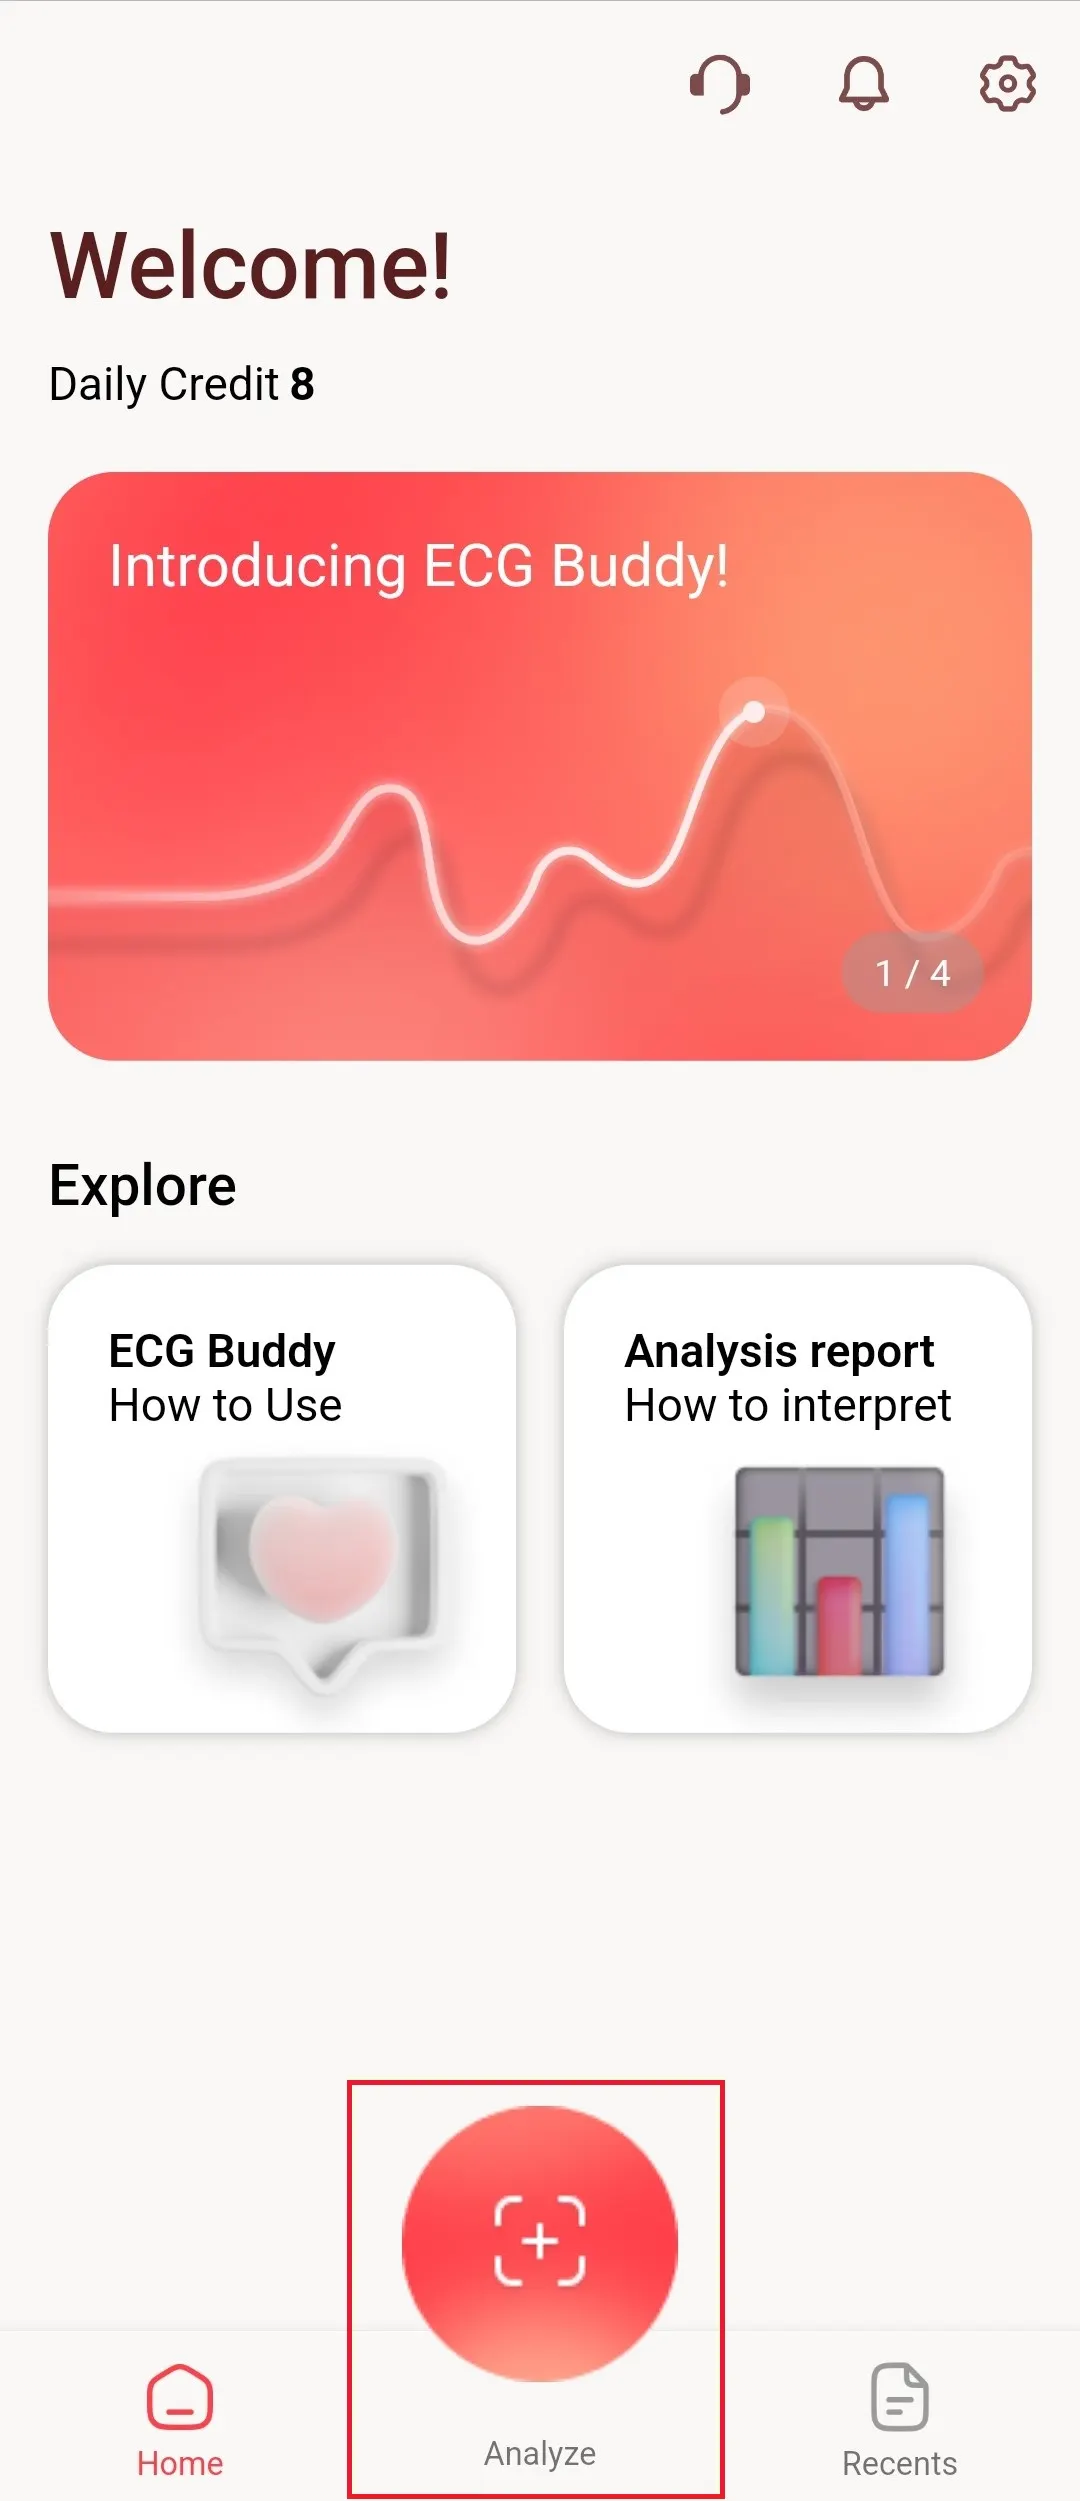

•
Click the Analyze button.
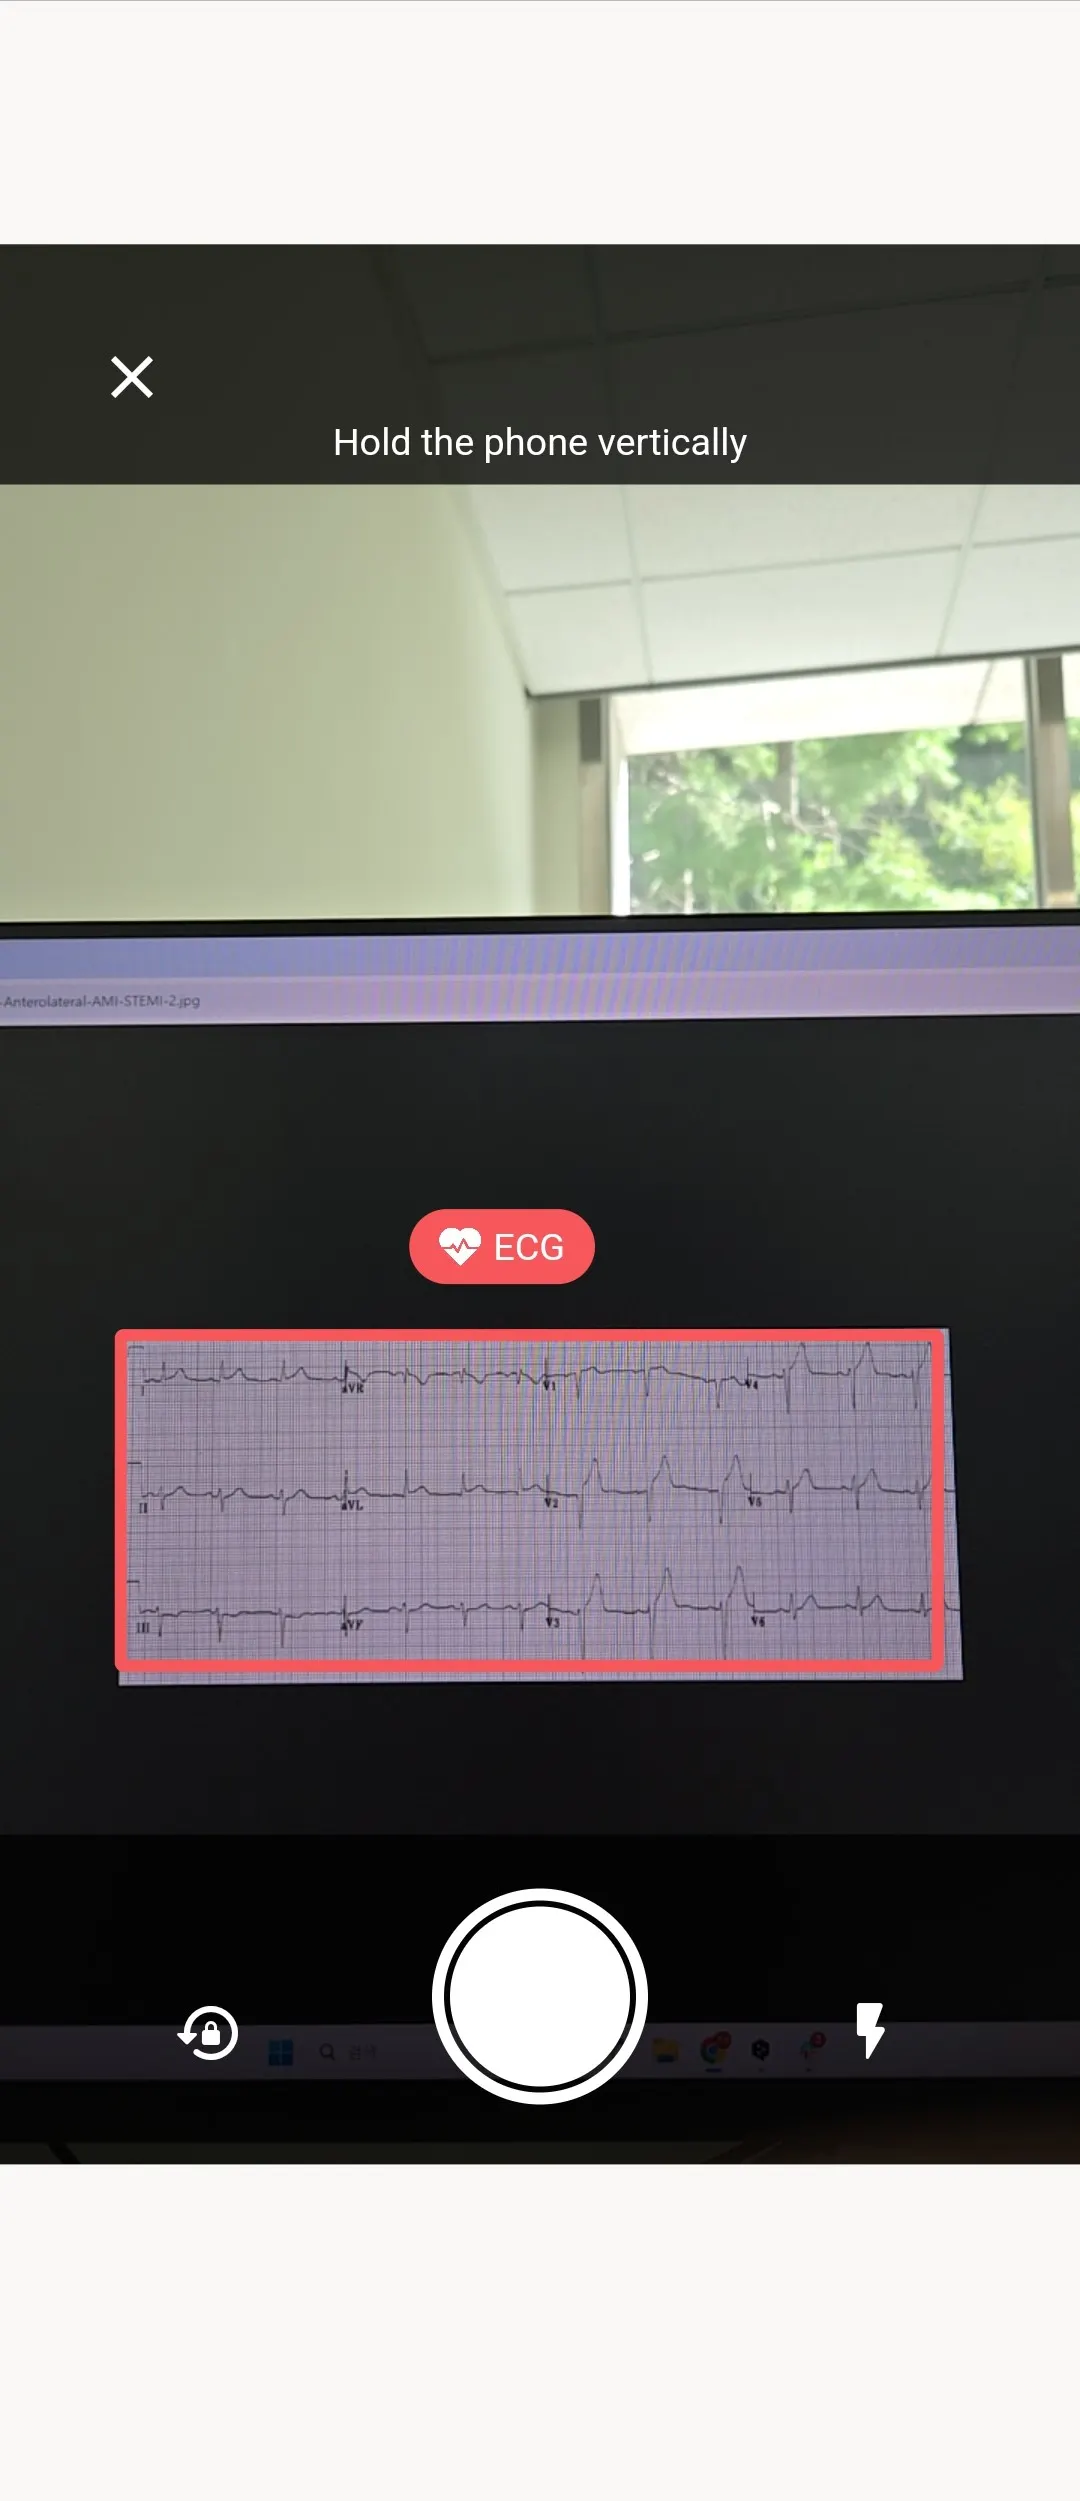
•
The screen automatically detects the area of the ECG image.
•
You can manually edit in the photo editing stage after taking a picture.
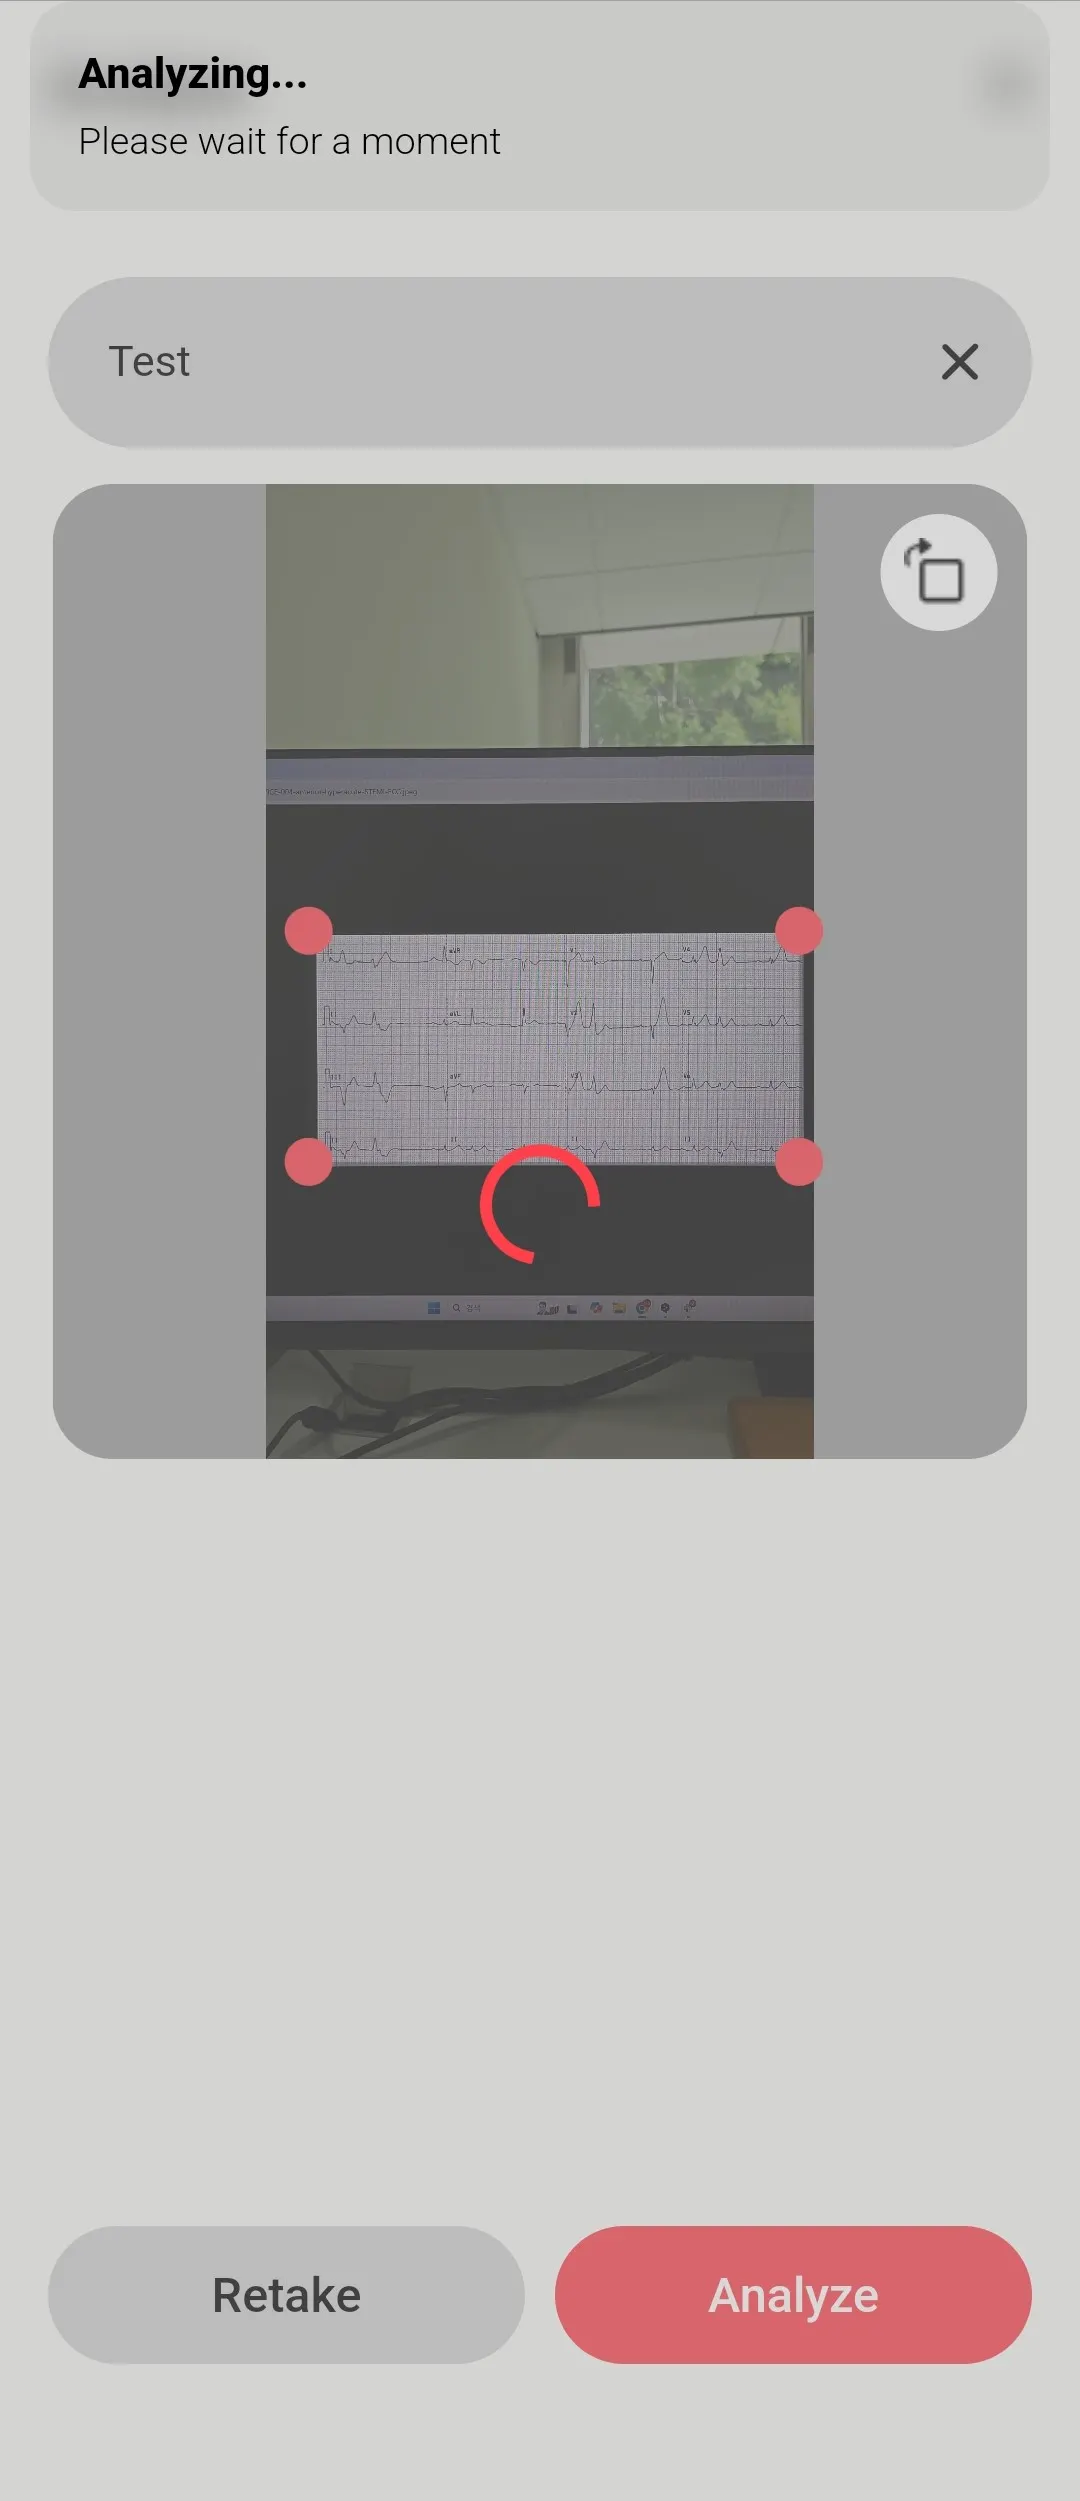
•
The name of the analysis report can be edited (the default is the date and time of the shot).
•
Press the Analyze button again to proceed with the analysis.
2. View analysis reports


•
While the analysis is in progress, a rotating circle will be displayed.
•
Once the analysis is complete, the icon will change to an arrow, and a notification will appear at the top of the application.
•
You can press the arrow to view the analysis report.
•
The analysis report can be accessed from Recents at the bottom right corner of any screen.
•
The analysis report will be automatically deleted from the server after 6 hours from the requested time, and it will no longer be accessible.


•
The analysis report is provided in Graphical View (left image) and Numeric View (right image).
•
The graphical view presents the type and probability of heart rhythm represented by the analyzed ECG and graphically displays digital biomarkers for 10 major emergency situations and cardiac dysfunctions.
•
The Numeric View displays the scores for the 10 digital biomarkers in a tabular format.
You can read more about how to interpret analysis reports on the pages below.
3. Other function
1) Exporting and printing the analysis report


•
You can save the report using the export function.
•
By clicking on the hamburger icon (left image), you can select the Export and Print buttons (right image).
•
You can save it as a PDF file or print it for your use :)
If you are, Still having trouble ECG analysis?

If you have any questions or need help during your ECG analysis, please contact us.
Contact >